Published in Medium ·

Your Year in Pixels: Get your Figma Playback for 2025

In short

Jinson Johny introduces Figma Playback, an app born out of the #FigmaMakeathon that connects to a Figma account and turns a file's version history, comments and contributors into a 'Year in Review' style report. Each slide pairs an interactive mini-game with a data insight, and the data is processed in the browser and never saved to servers.

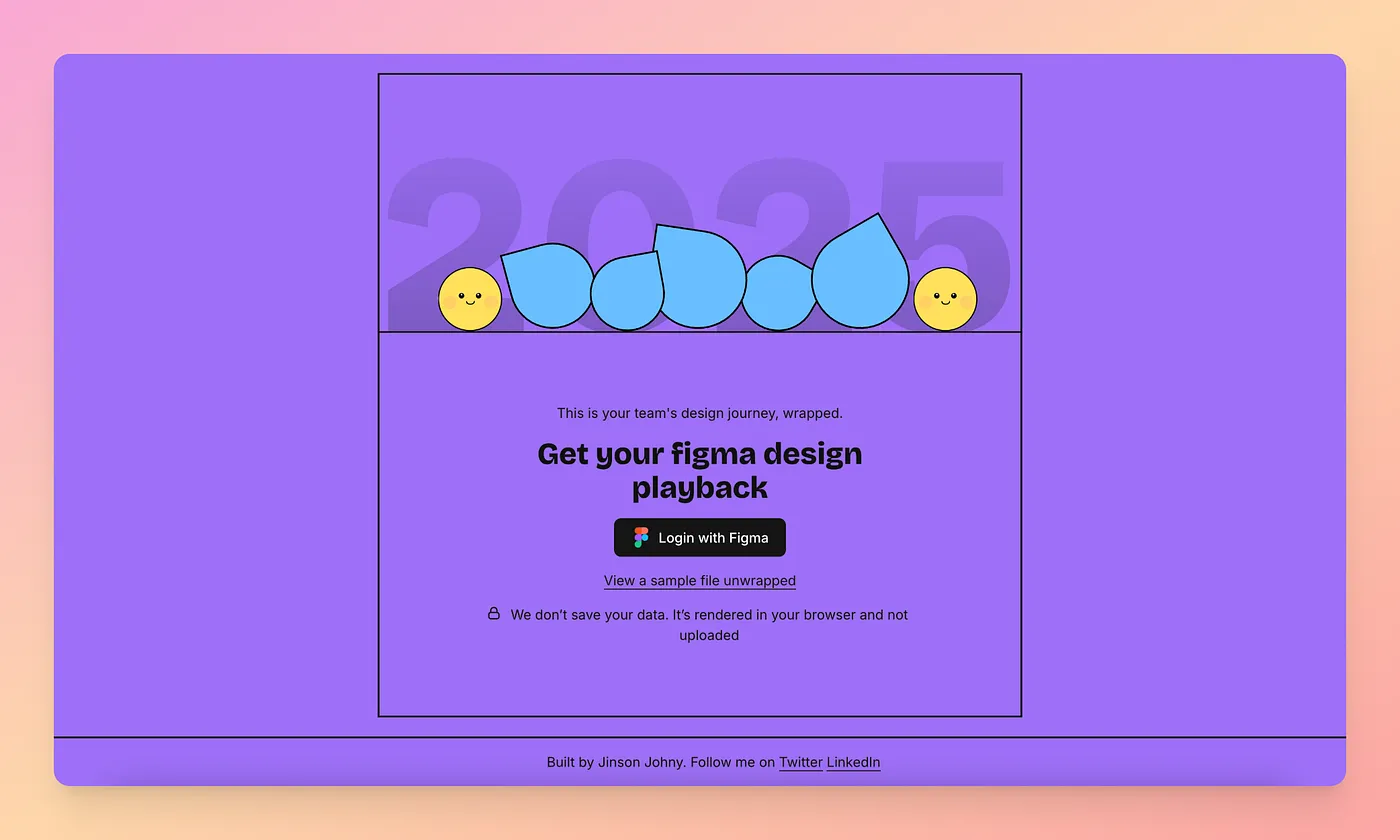
The Figma Playback start screen: “Get your figma design playback”, with a Login with Figma button.
Cover image from the original on Medium

Key takeaways

  1. Wrapped for designers. Music lovers and developers get yearly stats, so Playback gives designers a shareable look at the big picture of their effort.
  2. Gamified insights. Slides such as The Chief Comment Officer, The Midnight Oil Burners and the Slowest Replier pair an interactive motion area with a hard data insight.
  3. Metadata only. It uses the official Figma API to fetch only metadata like versions, users and comments, not design contents or pixel data.
  4. Best with teams. It runs on personal files but shines on team projects, turning the data into a team-bonding moment or friendly roast.

From the article

“Meet the people behind the pixels”: the recap introduces everyone who worked on the file.
“Your team was absolutely on fire”: the busiest day of the year, in versions and comments.
“The Great Debate of 2025”: the most-discussed comment thread, turned into a small game.
The finale: the whole year in versions, comments and members.

This is a summary. The full article lives on Medium, where it was first published.

Read the full article on Medium